
The quality of barn monitoring cannot be judged by the number of sensors installed alone. Methane sensor locations should be chosen with the measurement purpose, source distribution, and airflow in mind. Chapter 8 of Technology and Solutions for Demonstrating Carbon Reduction treats sensor placement as a matter of designing representative observations, not just a budgeting question.
Define the Concept and Scope of Application First
Spatial representativeness can vary with operating conditions. We need to examine how the state of the barn openings, fan operation, and changes in feeding and livestock areas affect measurement locations. The installation drawing alone cannot explain the meaning of data collected over a long period. If a sensor has been moved, assess whether data from before and after the move can be compared under the same conditions. Keep equipment identifiers and installation histories so that spatial changes can be distinguished from actual changes in emissions. Placement needs a rationale suited to the measurement purpose.
Which source of uncertainty dominates depends on the measurement conditions. In naturally ventilated barns, ventilation rate and spatial representativeness may contribute substantially; when reading small concentration differences, instrument repeatability, drift, and background correction may matter more. First prepare an uncertainty budget, then compare the cost of reducing each component with the improvement it brings to the final decision. More expensive sensors or more samples are not always the best investment.
Function checks. A bump test for a safety gas detector introduces gas to check sensor response and alarm function; it does not replace quantitative calibration. For a research-grade methane analyzer, perform checks suited to the purpose, such as zero and span checks under the manufacturer’s procedure, leak checks, and recovery tests. Passing a function check alone does not guarantee the accuracy of emissions measurement.
Reduction quantification requires both measurement traceability and calculation traceability. Connect measurements to a reference through a documented calibration chain and uncertainty, and trace activity data, emission factors, and models through to the final result using their sources, versions, and conditions of application. Not every reduction quantity comes from a single direct measurement. Reviewers need to check not only whether calculations can be reproduced but also whether the data and methods used are appropriate for the claim.
Concentration is the proportion of a gas in air, while emission rate is the mass emitted per unit of time. To measure or estimate emissions, we need to connect concentration and flow rate with a measurement model suited to the purpose. Even if concentration falls, we cannot assume that the mass emission rate will move in the same direction if airflow has increased. When converting an emission rate over time into total emissions, we also need to account for the measurement period and how missing intervals are handled.
When comparing sensors, check measurement range and resolution, cross-sensitivity to other gases, response time, and drift together. Environmental conditions such as temperature, humidity, and dust, as well as calibration requirements, also need review. If the purpose is to distinguish small concentration differences, examine for each product and operating mode whether its display units and uncertainty suit that purpose. The name of the sensor principle cannot replace these checks.
Conditions and Limits in Field Application
Suppose the same equipment is installed in two areas with different airflow. Even if the equipment performs equally well, the extent to which each location represents the whole barn may differ. To determine whether a change at a particular location reflects a feed effect or a local airflow change, we need the placement rationale and operating records. Simply adding sensors does not eliminate bias.
There are items that must be documented in a placement plan: each sensor’s exact location (coordinates and height on a floor plan), orientation, nearby structures, distance from nearby air inlets and outlets, and any changes made after installation. Barns keep changing. Partitions are added, fans are replaced, and feed troughs are moved. If these changes are not recorded, data discontinuities remain unexplained.
Methane concentration is recorded by the sensor gateway’s clock, feeding times by the automatic feeder’s clock, ventilation fan status by the control system’s clock, and temperature and humidity by yet another logger’s clock. If these clocks are off by a few minutes, the pattern “methane rises after feeding” may disappear—or a pattern that never existed may appear.
AI evaluation data should be divided according to the intended use. To predict future operation, consider preserving time order; to deploy at other farms, consider separating data by farm. Also separate the data used for model selection from the data reserved for final performance checks. Compare the model with a simple baseline and check not only average error but also biases by farm and season and conditions where it fails. This is needed to explain the actual scope of use.
Evidence Needed for Investment Review
Investors should check what changes the placement plan is intended to detect. They should not assume that the placement criteria for environmental monitoring and emissions quantification are the same. Check whether location changes, maintenance, and communication dropouts are recorded and whether representativeness at the actual site has been reviewed.
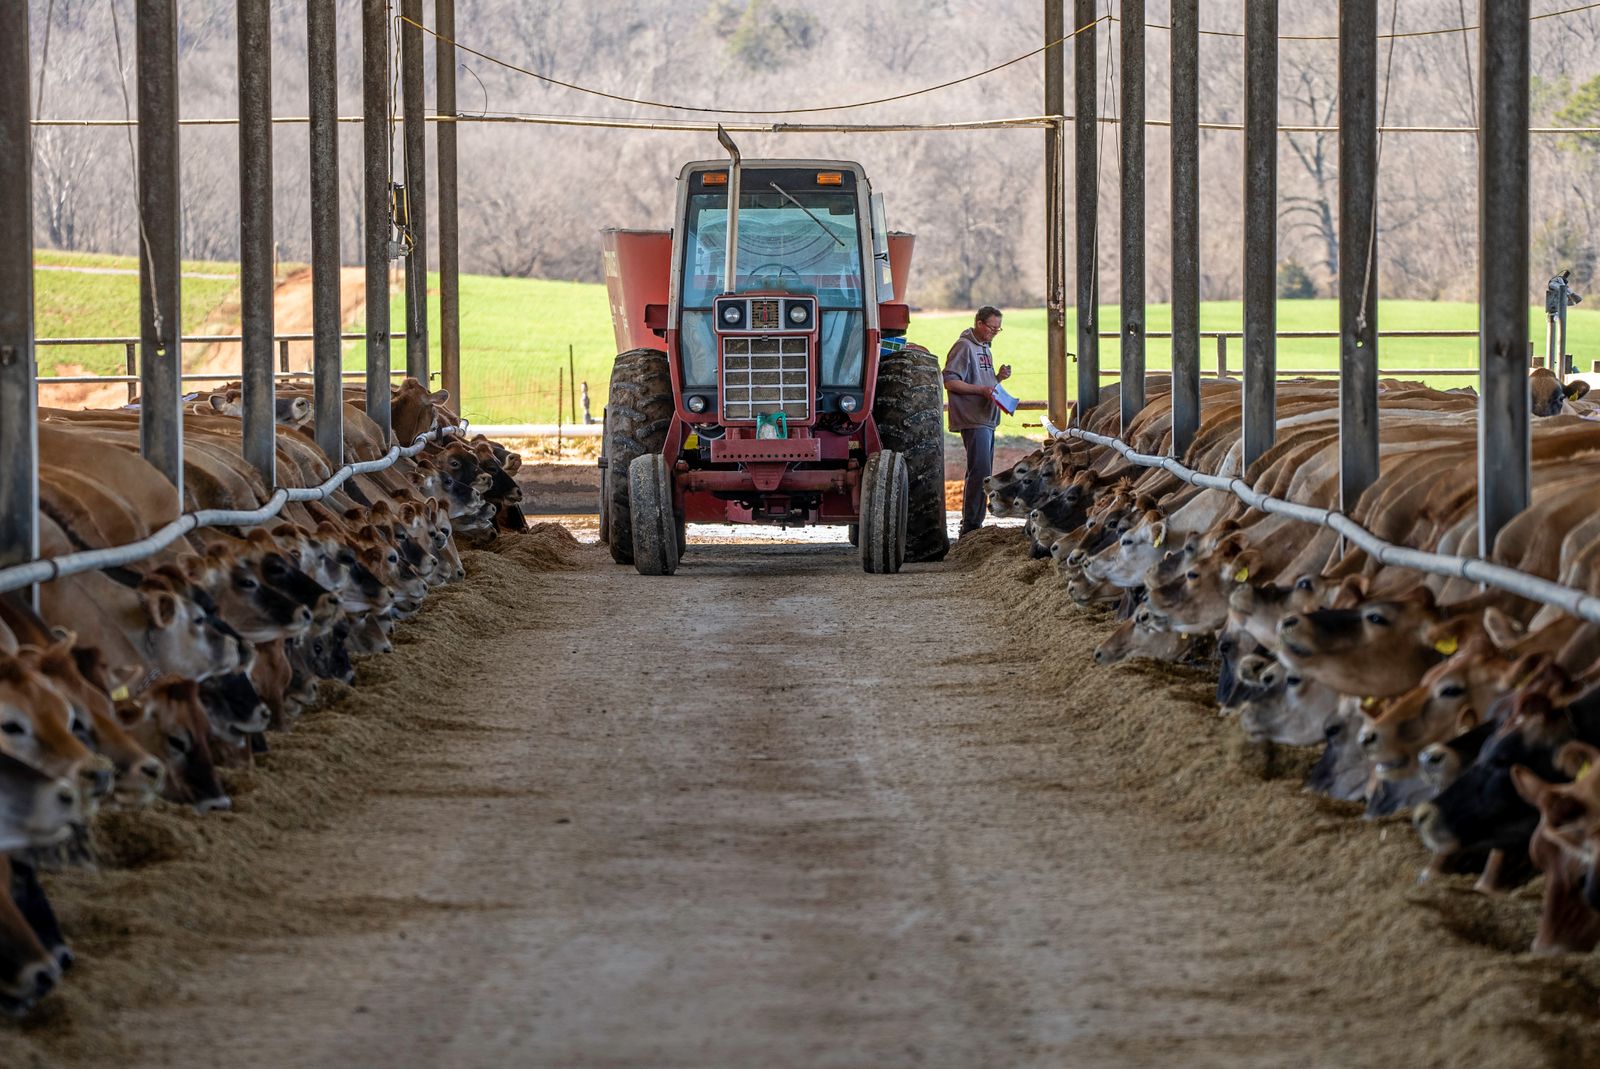
To understand a farm’s numbers, start by examining the space in which they were produced. The barn structure and airflow, where the animals spend time, and the routes used for feeding and cleaning are starting points for determining observation locations and maintenance plans. The design should also cover how to secure reliable data continuously as part of the farm’s daily operations.
When comparison is difficult, repeated baseline measurements can help identify variability and time trends, but we should not assume those data alone have removed every confounding factor. Even when a change is smaller than the natural variation in individual observations, sufficient independent replication can estimate the average effect. Conversely, even an apparently large difference may reflect seasonal or growth effects. Present the effect estimate and confidence interval along with the limits of causal interpretation.
Once the pilot ends, a decision has to be made. Yet this is the decision most often postponed. It is common to drift into a “second pilot” without reaching a conclusion. Costs continue, but learning does not increase.
Criteria to Keep in View
Sensor placement starts by defining the question and examining spatial and temporal variation. Locations should be chosen by comparing the quality and cost of the data needed. The installation drawing and actual operating records should both be retained so the next reviewer can understand what the data mean.
About the Author
Bongjun Lee graduated from the Graduate School of Management of Technology (MOT) at Sogang University. He spent seven years at Infitron Co., Ltd. and 20 years at Honeywell, working for a total of 27 years in gas measurement in service engineering, technical sales, and channel management. He is now the founder of AI Safety Korea Co., Ltd., where he is researching livestock methane monitoring and measurement, reporting, and verification (MRV) systems using sensors, AI, and data analytics.