
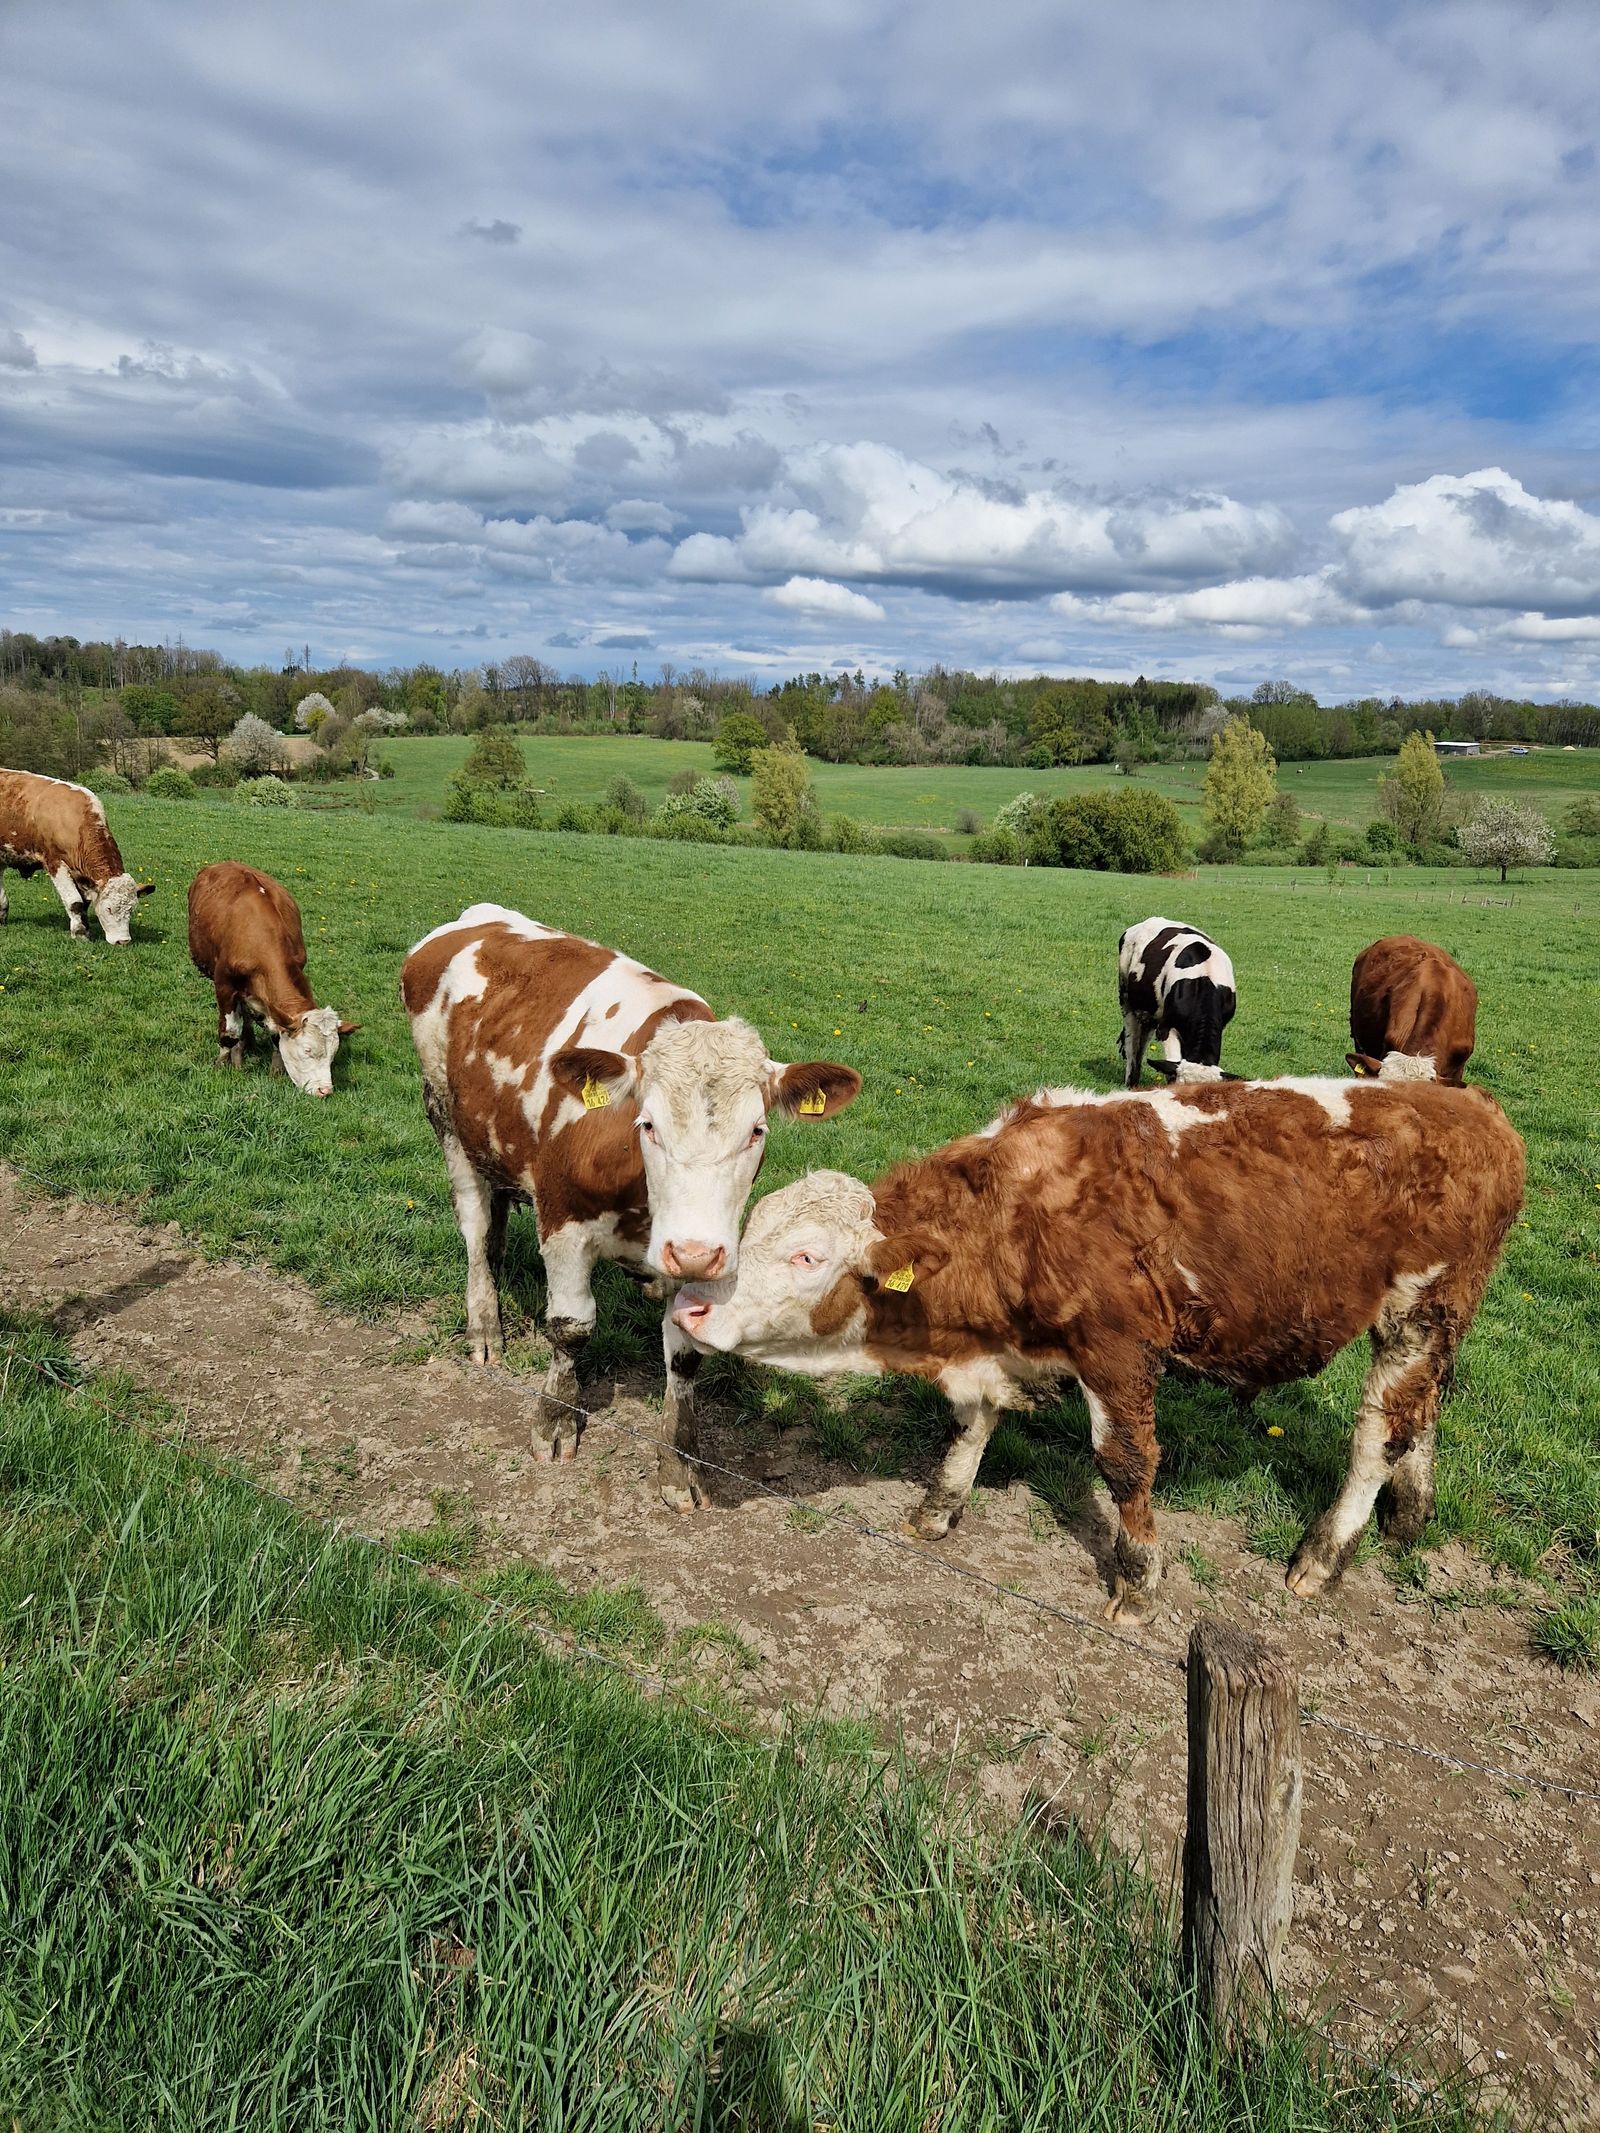
You may have heard methane described as a more powerful greenhouse gas than carbon dioxide. If so, is it enough to remember a single number for how much more powerful it is? In Chapter 5 of Technology and Solutions for Demonstrating Carbon Reduction, I suggest reading that number together with the time period over which it was calculated. That is an essential condition for understanding methane’s greenhouse effect and global warming potential (GWP).
A distinction to make first as you read the book
When you read a converted value, note both the amount of methane itself and the basis used to convert it. If the basis changes, you can distinguish a change in actual activity from a change in the calculation. Comparing results from different indicators as though they were the same emissions reduction can obscure their meaning. You should also distinguish a question about climate effects over a short period from an accounting question tied to a long-term target. Rather than focus on which indicator gives the larger number, I hope you will first consider which basis is needed for the decision at hand.
Methane remains in the atmosphere for about 12 years, a shorter period than carbon dioxide, whose effects last for hundreds of years or more. At the same time, methane’s radiative forcing per unit of mass is much greater. This combination makes methane a distinctive target for reduction.
Methane reduction is an important means of limiting near-term warming. However, the fact that emissions from one sector have fallen does not, by itself, let us conclude that the global atmospheric methane concentration will decline within a given period. The concentration pathway depends on total emissions and removal processes in the atmosphere, while the temperature impact also depends on the scale and duration of the reduction. That is why rapid and sustained methane reductions matter.
GWP is an indicator that compares the impact of a greenhouse gas with carbon dioxide over a defined time horizon. GWP100 and GWP20 use 100-year and 20-year horizons, respectively. The same mass of methane converts to a different amount of carbon dioxide equivalent depending on the indicator and time horizon used, so state both the original mass and the conversion basis. Do not add together or directly compare values calculated with different indicators as if they were results under the same conditions.
In a cow’s rumen, microorganisms break down fiber to produce volatile fatty acids, which the cow uses as an energy source. One pathway that consumes hydrogen produced during fermentation is methanogenesis. Because changes in the balance between hydrogen production and use can alter fermentation, observe digestion, feed intake, and production performance alongside methane-reduction effects.
Methane from enteric fermentation is released mainly through the mouth and nose, so breath-collection equipment measures gases around the animal’s head. GreenFeed attracts animals with feed and captures gas from those that visit. However, if observations are concentrated at particular times, such as just after feeding, they may not represent daily emissions. Check the distribution of visit and measurement times and the quality of gas capture. For chambers and tracer-gas methods, apply each method’s principles for time integration and sample design.
Manure methane emissions are affected by organic matter, temperature, storage duration, and management practices. Long-term anaerobic storage of liquid manure can increase methane production. However, the size of atmospheric emissions cannot be judged from whether storage is sealed alone. Also examine whether the gas produced is captured, flared, or used, as well as leakage and uncombusted emissions. IPCC methodology also distinguishes methane conversion factors by management practice from recovered methane.
What to look for in the field
Imagine two reports with different converted results. The difference may reflect a difference in the actual amount of methane, but it may also be due to different indicators or time horizons. To compare the same thing, put the original gas quantity and the conversion basis side by side. Simply choosing the larger number makes it difficult to explain climate effects accurately.
The manure pathway also produces nitrous oxide (N2O), in addition to methane. On a GWP100 basis, nitrous oxide is a much more powerful greenhouse gas than methane, and it is generated during nitrogen treatment processes. There is a trade-off here. Aerobic manure treatment intended to reduce methane emissions can increase nitrous oxide emissions. Conversely, capturing methane through anaerobic digestion reduces methane, but other emissions may arise from managing the digestate.
If feed efficiency improves so that the same output is achieved with fewer inputs, there may be potential to reduce emissions. However, results vary with the methane conversion rate, emissions from feed production, and changes in output, so we cannot conclude that both total methane and emissions intensity will necessarily decline. Changes in raising period, fertility rate, mortality, and feed formulation should also be assessed against production outcomes and the emissions boundary.
Questions to ask in an investment review
When reviewing company materials, ask which indicator was applied. Check the purpose of the calculation and the basis used. Comparisons can become unreliable if effects calculated on different bases are simply added together or treated as a ranking of products. It is best not to omit the conversion basis from investment materials.
Policy design considers together the goals of reducing total emissions, improving production efficiency, and maintaining food supply. An intensity indicator alone may miss an increase in total emissions caused by expanded production, while a total-emissions indicator alone may make it difficult to distinguish efficiency gains from reduced production. Managing both indicators together is one useful option, but it is not the only possible design. Set primary and supporting indicators in line with policy objectives, and assess leakage from shifted production and distributional effects separately.
The concentration difference between inside and outside a livestock barn is affected not only by emissions but also by ventilation and air mixing. If the air is sufficiently mixed and gas accumulation inside the barn can be ignored, then, for the same emissions rate, doubling ventilation will roughly halve the concentration difference. To use this relationship in an emissions calculation, account for ventilation rate, background concentration, temperature and pressure, and unit conversions together.
A question to leave with before closing the book
To explain the value of reducing methane accurately, state the indicator’s name and its time horizon together. Also consider separately how methane reductions relate to carbon dioxide reductions. The context needed to understand the number should accompany it.
About the author
Bongjun Lee graduated from the Graduate School of Management of Technology (MOT) at Sogang University. He spent seven years at Infitron Co., Ltd. and 20 years at Honeywell, working for a total of 27 years in gas measurement in service engineering, technical sales, and channel management. He is now the founder of AI Safety Korea Co., Ltd., where he is researching livestock methane monitoring and measurement, reporting, and verification (MRV) systems using sensors, AI, and data analytics.