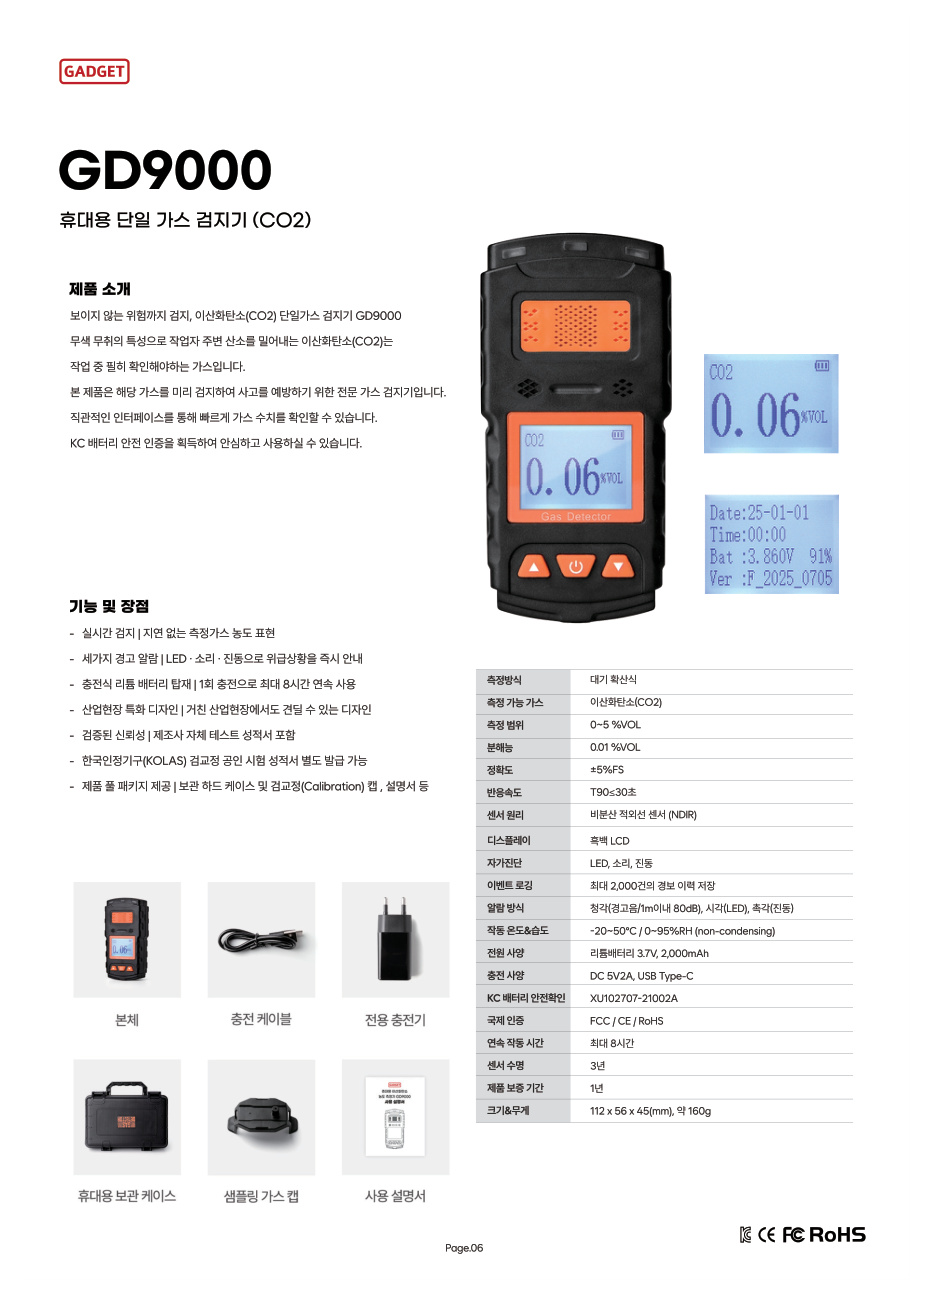

If the GD9000 stores 2,000 alarm records, can you also receive a file showing how CO₂ concentration changed over a period of time? They are both called “records,” but a log of alarm events is different from time-series data containing concentration values at regular intervals. First distinguish what kind of record the report requires.
Alarm history records events
Alarm history is an event log that saves information related to the time an alarm occurs. Time-series data logging, by contrast, continuously saves measurements at a defined interval even when no alarm occurs. The first helps answer “What happened?”; the second helps show “How did the value change over time?”
Imagine a hypothetical record table in which an alarm occurred once at 10:17 a.m. The event log might retain one record for that event. Separate time-series data might contain a row with the measured value at 10:15, 10:20, and 10:25. One alarm record shows when an event occurred but does not provide values at the surrounding times. These times and intervals are hypothetical illustrations of the concepts, not a description of the GD9000’s actual recording functions.
Display values and recording intervals determine time resolution
A value checked on the screen once is an observation at that moment. If samples are recorded at a fixed interval, the saved data contains the readings at the sample times. For example, saving every five minutes does not mean every moment within those five minutes was measured; it stores the result at each save time. A longer interval may miss brief changes between readings, while a shorter interval requires more records over the same period.
Therefore, when reviewing data, check not only the values but also the time shown for each row and whether the interval is consistent. The required interval depends on whether the recipient needs to see short changes or a broader long-term trend. The reporting purpose and site requirements determine that choice; this explanation does not claim that the GD9000 allows the recording interval to be configured.
Record capacity is not the same as retention period
Even if a storage capacity is 2,000 records, that number alone does not tell you how many days or hours of data will remain. If one time-series value were saved every minute, 2,000 records would equal 2,000 minutes by arithmetic. If only alarm events were saved, the period covered by the same capacity would depend on how frequently alarms occurred. This hypothetical calculation illustrates the difference between storage methods; it is not the GD9000’s actual logging interval or retention period.
The fields in each record, whether older data is overwritten when the limit is reached, and how long records can be viewed on the instrument are specifications separate from capacity. “Up to 2,000 records” states a record limit; it does not describe the retention period or an automatic deletion policy.
Device history and report files are separate steps
Viewing a past record on the instrument is different from transferring it to a computer as a file. External transfer may require a connection method, software, or file format. Even if a file can be obtained, confirm that its date range, time information, and units match the report form. For example, if a recipient asks for the time an alarm occurred, an event log may be relevant. If the recipient asks for a five-minute concentration trend, you need values saved at that interval with time information.
Irregular intervals also affect how averages are interpreted
If samples were not measured at equal intervals, the arithmetic mean of the recorded values may not represent the average over the whole period. As a hypothetical illustration, suppose observations were 0 ppm at 10:00, 60 ppm at 10:10, and 0 ppm at 11:00. The simple arithmetic mean of the three numbers is 20 ppm because each observation receives equal weight.
To average values over time, consider how long each observation represents. If you use a trapezoidal calculation that assumes values changed linearly between observations, the average for the first ten-minute interval is 30 ppm, and the average for the next fifty-minute interval is also 30 ppm. The estimated time-weighted average for the hour is therefore 30 ppm. It differs from 20 ppm because the ten- and fifty-minute intervals have different durations. This calculation is a mathematical example to explain irregularly timed observations; it is not actual CO₂ concentration, a GD9000 result, or an official reporting rule. There is no guarantee that the actual value changed linearly between samples.
Even when a result needs an average, first confirm the original data interval and calculation method. The GD9000 catalog states that up to 2,000 alarm records are available, but that information alone does not establish periodic concentration storage, irregularly timed data, retention period, external export, or an average-report feature. Ask AI Safety Korea Co., Ltd. about the report type you need and the range of records the GD9000 provides.
Ask About GD9000 Record Features