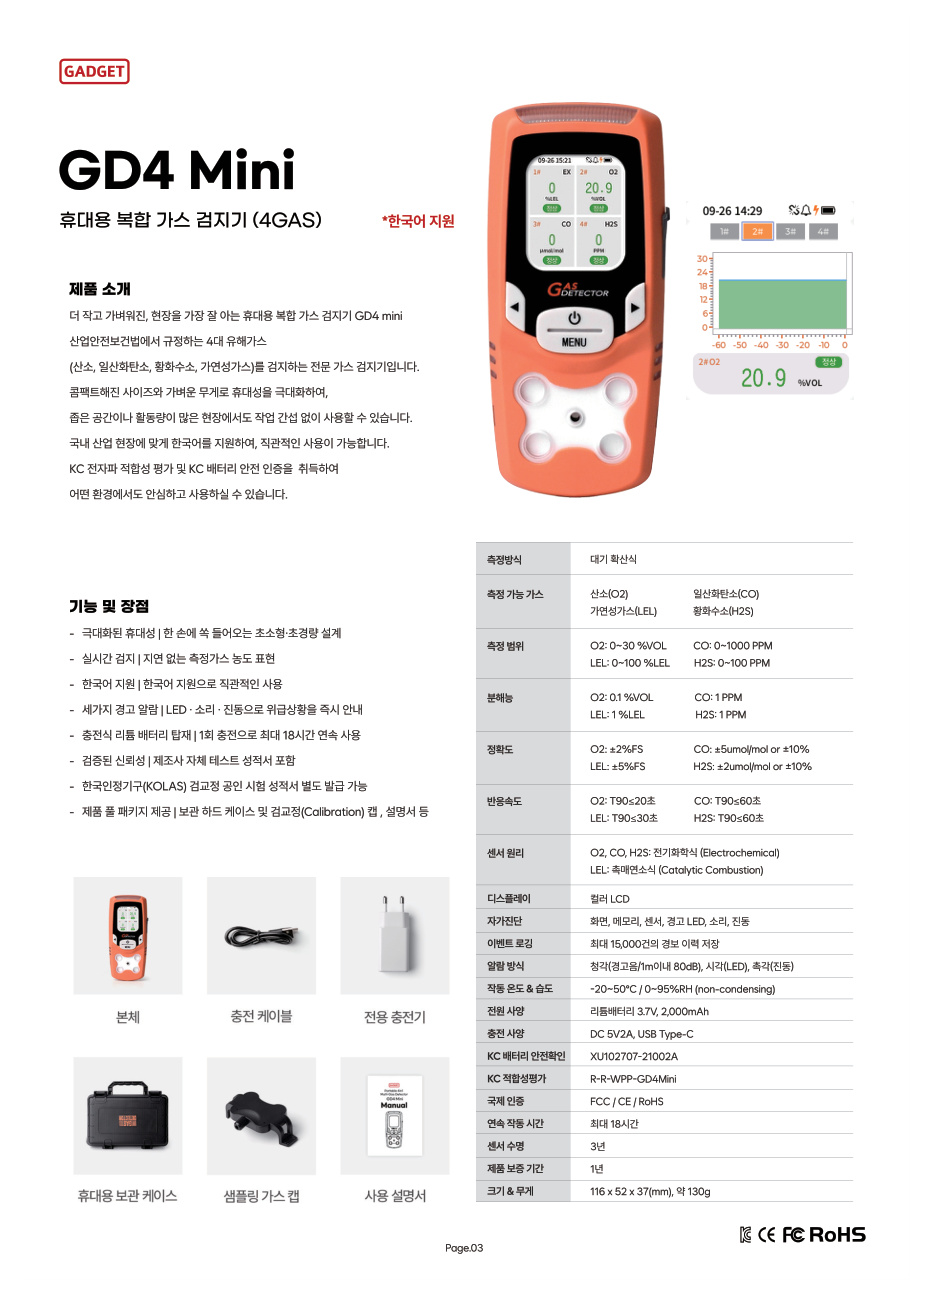
You may wonder whether the number beneath a photo of a GD4 Mini graph is the current concentration or a past value. In general, a current reading is a display at one moment; a time graph shows how measurements change; and an event record describes an occurrence such as an alarm or status change. Each format answers a different question, so you cannot infer the others from just one of them.
A current value is information on the screen at the moment
Imagine a screen photo taken at 2 p.m. showing `20.8 %VOL` on the oxygen channel. The photo shows the oxygen value displayed at that moment. It cannot tell you from one number whether the reading stayed the same from 1 p.m. or changed in between. Read the gas type and unit together; do not interpret a number on another GD4 Mini channel as an oxygen value. This is a hypothetical example for explanation, not an actual product performance value or threshold.
Read a time graph from its axes and displayed interval
A graph usually shows time on one axis and a measured value on the other. First check the units of the horizontal and vertical axes, the spacing between ticks, the displayed range, and which end represents the latest value. The same line can represent very different changes depending on whether the time ticks are five minutes or one hour apart. If a graph has two points, whether every moment between them was actually measured depends on how the data was recorded. The public GD4 Mini catalog includes an example graph for the oxygen channel, but does not establish the precise time axis, display period, or sampling interval, so a specific time interpretation cannot be given.
Events and continuous data serve different recording purposes
An alarm event may provide information that an alarm occurred at a particular time. A continuous or periodic measurement log is separate data that records concentration values at multiple times. Saving an event does not mean all concentrations before and after the alarm were also recorded. Likewise, seeing a graph does not prove that files can be exported or reports generated. Stored fields, interval, retention period, and external transfer features must each be confirmed for the model. The public materials do not establish these graph and logging details for the GD4 Mini.
When examining a screen, distinguish the model, selected channel, unit, axes, and time the photo was taken, then compare those details with materials for that model. Do not apply an unconfirmed time interval or storage feature from another product.
Seeing a graph does not mean a record was stored
A graph can appear on a screen in different ways. It may visualize recent values within the current screen, display a periodic log stored in the instrument, or be based on a particular event record. The shape alone cannot tell you which method is used. A graph on screen does not prove that historical data was saved to a file or can be exported. Such features are established only when the manual separately specifies stored data, retention period, and export functions.
When interpreting a time axis, gaps matter as well as tick spacing. If only two measurements stored ten minutes apart are shown, that is not the same as measuring every moment in between. Connecting two points with a line may make a change easier to see, but it does not reconstruct values that were never recorded. The public information does not confirm the GD4 Mini’s recording interval, so this general principle should not be treated as a claim about its specific logging function.
As a hypothetical example, suppose an event list contains one line, `14:02 Alarm`, and a graph shows values only at 14:00 and 14:10. The event may identify an occurrence at 14:02, but it does not tell you the concentrations at 14:01 or 14:03. The two graph points are values for their respective stored times; they do not mean every minute was measured. Do not fill in the line between the points or infer the exact concentration at the alarm time just because an event occurred. This example explains the difference between record formats and does not claim anything about the GD4 Mini’s menus or storage features.
The graph shown in the GD4 Mini catalog is an example of a display. Do not borrow an unconfirmed axis, period, or storage method from another product’s menus; interpret only the symbols actually visible and what the manual for the particular model establishes.
Also distinguish the file creation time of a photo from the date and time shown on the instrument screen. If the screen clock is not confirmed to be synchronized with actual time, do not map the photo’s capture time directly onto the graph’s time axis. For example, a phone photo saved at 14:05 does not prove that the rightmost graph point is a measurement from precisely that time. This relationship depends on the display method and instrument settings.
Decide which part of the GD4 Mini graph you need to confirm—current value, axes, or time range—and ask about it.
Ask About GD4 Mini Readings and Graph Features